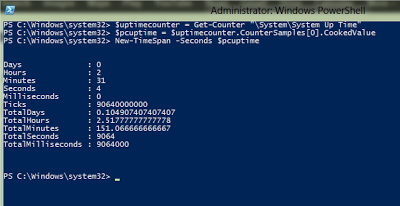
$uptimecounter = Get-Counter "SystemSystem Up Time"

$pcuptime = $uptimecounter.CounterSamples[0].CookedValue

New-TimeSpan -Seconds $pcuptime
Here’s i can see my Server Up Time Information in a very detailed manner.

Below command gives a list of all available counters
PS C:Windowssystem32> Get-Counter -List * | Format-List CounterSetName,Description
CounterSetName : RAS
Description : VPN counters which keep track of their values since service start
CounterSetName : WSMan Quota Statistics
Description : Displays quota usage and violation information for WS-Management processes.
CounterSetName : BranchCache
Description : Counters for measuring bandwidth and latency for BranchCache.
CounterSetName : Network QoS Policy
Description : This counter set consists of flow statistics specific to a network QoS policy.
CounterSetName : SMB Client Shares
Description : This counter set displays information about server shares that are being accessed by the client using
SMB protocol version 2 or higher.
CounterSetName : SynchronizationNuma
Description : The Synchronization performance object consists of counters for kernel synchronization. The
synchronization object represents each processor as an instance of the object. The counters are
aggregated based on the system NUMA topology.
CounterSetName : Synchronization
Description : The Synchronization performance object consists of counters for kernel synchronization. The
synchronization object represents each processor as an instance of the object.
CounterSetName : Event Tracing for Windows
Description : The counters in this collection refer to system-wide metrics about the performance of the Event
Tracing for Windows subsystem.
CounterSetName : Processor Information
Description : The Processor Information performance counter set consists of counters that measure aspects of
processor activity. The processor is the part of the computer that performs arithmetic and logical
computations, initiates operations on peripherals, and runs the threads of processes. A computer can
have multiple processors. On some computers, processors are organized in NUMA nodes that share
hardware resources such as physical memory. The Processor Information counter set represents each
processor as a pair of numbers, where the first number is the NUMA node number and the second number
is the zero-based index of the processor within that NUMA node. If the computer does not use NUMA
nodes, the first number is zero.
CounterSetName : Event Tracing for Windows Session
Description : The counters in this collection are related to individual Event Tracing for Windows sessions.
CounterSetName : FileSystem Disk Activity
Description : The FileSystem Disk Activity performance counter set consists of counters that measure the aspect of filesystem’s IO Activity. This counter set measures the number of bytes filesystem read from and
wrote to the disk drive.
CounterSetName : RDMA Activity
Description : The RDMA Activity counter set measures RDMA activity on a NetworkDirect-capable network interface card.
CounterSetName : Per Processor Network Activity Cycles
Description : The Per Processor Network Activity Cycles counter set measures processor
cycles due to network activity of an interface on each processor.
CounterSetName : Per Processor Network Interface Card Activity
Description : The Per Processor Network Interface Card Activity counter set measures network activity of a network interface card per processor.
CounterSetName : Physical Network Interface Card Activity
Description : The Physical Network Interface Card Activity counter set measures events on a
physical network card.
CounterSetName : Distributed Routing Table
Description : The Distributed Routing Table (DRT) performance object consists of counters that monitor the local DRT cache as well as counters that measure the rates at which DRT protocol messages
are sent and received.
CounterSetName : Netlogon
Description : Counters for measuring the performance of Netlogon.
CounterSetName : SMB Server Sessions
Description : This counter set displays information about SMB server sessions using SMB protocol version 2 or higher
CounterSetName : SMB Server Shares
Description : This counter set displays information about SMB server shares that are shared
using SMB protocol version 2 or higher.
CounterSetName : RemoteFX Network
CounterSetName : Hyper-V Dynamic Memory Integration Service
Description : This counter set represents the statistics for Dynamic Memory Integration Services
🙂